How I build
The AI chart looked convincing. The customer group had changed.
A worked revenue example shows how changing the customer group creates a false trend—and what I required the AI report to fix.
Published: Updated:
In this article
- A falling line without falling customer value
- Revenue growth and customer development are different questions
- Monthly revenue is not cumulative revenue
- The denominator makes another business decision
- What I would require from the AI analysis
- Three questions before acting on the chart
- What the real work established
An AI-generated report can contain correct arithmetic and still tell the wrong business story. The problem can sit in the comparison itself: who is included, which period they have lived through and what the word “revenue” means on the axis.
I encountered this while working with AI on a revenue-based cohort report. I wanted to follow the same customers over comparable periods. I explicitly challenged a comparison whose population changed between horizons and asked for it to be corrected.
AI agents implemented the calculation and reporting changes. My contribution was to define the business question and insist that the output answer it.
The experience made me less interested in whether a chart looks analytical and more interested in what stayed constant between its points.
A falling line without falling customer value
Consider a completely hypothetical business. These are invented teaching figures, not my customer data or results. Group A contains 100 earlier customers. Group B contains 100 later customers. A has completed six observation months; B has completed three.
| Group | Original customers | Cumulative revenue M3 | Revenue per original customer M3 | Cumulative revenue M6 | Revenue per original customer M6 |
|---|---|---|---|---|---|
| A | 100 | $10,000 | $100 | $14,000 | $140 |
| B | 100 | $30,000 | $300 | Not yet observed | Not yet observed |
Here, M3 means the starting calendar month plus the next two; M6 includes the starting month plus the next five. These are calendar buckets, not exact 90-day or 180-day windows.
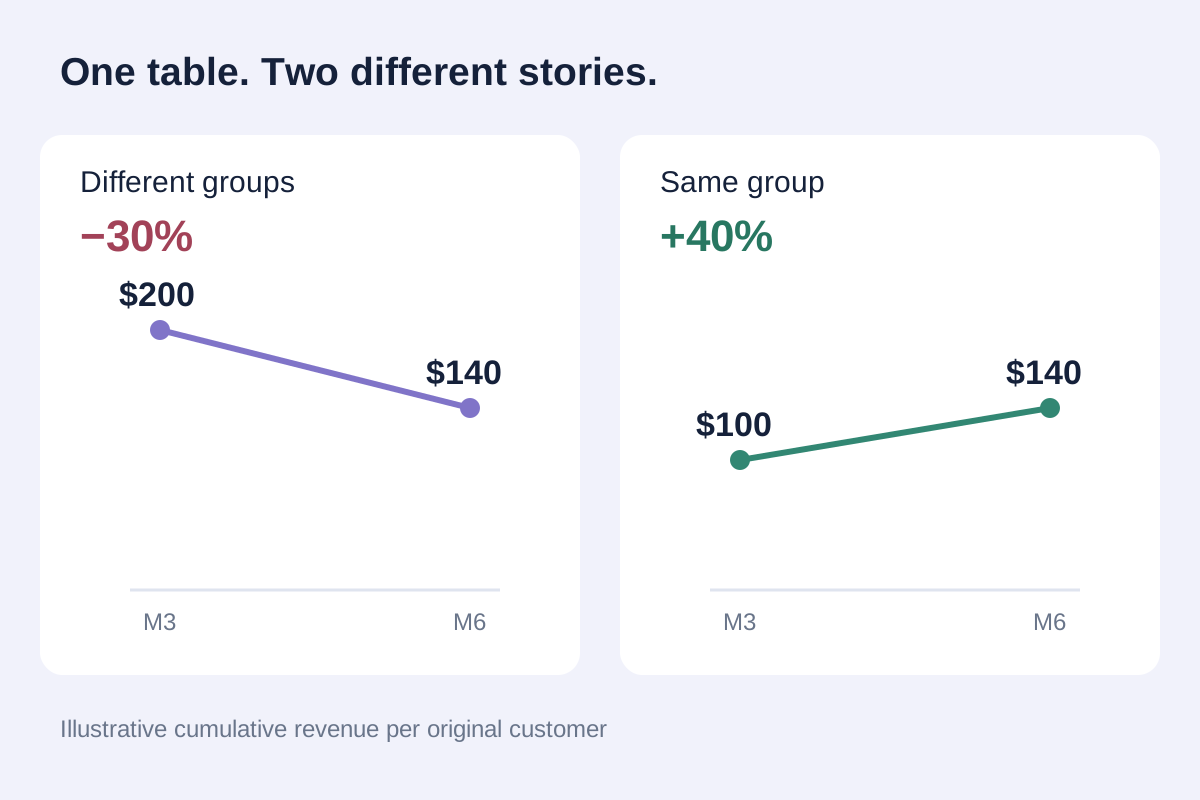
An automated summary uses everyone eligible at each horizon. Its M3 average is ($10,000 + $30,000) ÷ 200 = $200. Its M6 average is $14,000 ÷ 100 = $140. Connect those points and the apparent change is ($140 ÷ $200) − 1 = −30%.
That line can invite the explanation “customer value deteriorates after month three”. But the evidence does not support that explanation. Group A actually develops from $100 to $140 per original customer: a 40% increase, against the mixed line’s apparent 30% fall. Group B's six-month result is unknown.
The repair is to show A's $100 → $140 curve and keep B's $300 three-month result in its own cohort row. The mixed averages can remain useful as separately labelled cross-sectional summaries. They cannot silently become one group's journey.
Revenue growth and customer development are different questions
A calendar-month revenue total answers what the business earned in that month. It combines customers of different ages and can rise because more new customers arrived, because their purchase sizes differ or because existing customers spent more.
A cohort view asks how people with a common starting event developed at a comparable age. Neither view replaces the other. I would use calendar revenue to understand the business's scale, then cohort comparisons to investigate how that scale is being produced.
ChartMogul's documentation makes a helpful distinction between cohort rows and intervals since each cohort began. It also leaves future intervals blank. That structure makes the time question visible before someone draws a growth narrative from the colours. ChartMogul: Cohort analysis
Monthly revenue is not cumulative revenue
Keep using hypothetical group A. Suppose its revenue over the first six observation months is $4,000, $3,500, $2,500, $1,500, $1,500 and $1,000. The first three sum to $10,000; all six sum to $14,000.
Monthly revenue per original customer is $40, $35, $25, $15, $15 and $10. Cumulative revenue per original customer is $40, $75, $100, $115, $130 and $140.
Both series describe the same group. Monthly revenue has fallen from $40 to $10 per original customer, while cumulative revenue continues to grow.
Calling either series simply “customer value” hides a consequential difference. I want the label to state whether each point is the revenue earned during that month or the sum earned through it.
With non-negative revenue, cumulative revenue cannot fall for a fixed group and denominator. Refunds, credits, reversals or a different net-revenue definition can change that. An unexpected decline should trigger a check of the metric and data, not an automatic conclusion that the model failed—or that customers became less valuable.
The denominator makes another business decision
Revenue per original customer divides a group's revenue by its original membership. If some customers stop buying, they remain in the denominator. Their subsequent zero revenue is part of the group's economics.
If only 50 of A's original 100 customers are still active, dividing its cumulative $14,000 by those 50 produces $280. Dividing by the original 100 gives $140.
The first calculation combines all members' historical revenue with only the survivors in the denominator. It is neither revenue per original customer nor a clean measure of current active-customer revenue.
A genuine active-customer metric needs its own defined numerator and period. It may be useful, but it answers another question.
Amplitude's N-Day LTV documentation similarly distinguishes cumulative revenue across a cohort from an option restricted to users who generated revenue. It also excludes cohorts that have not completed the selected observation window from that horizon's aggregate. Amplitude: N-Day LTV
Before
After
What I would require from the AI analysis
I would give the system a definition before asking for an explanation: the start event, cohort membership, revenue basis, denominator, time convention and treatment of incomplete periods. Then I would require the chart to retain those definitions in its labels and drill-downs.
For the hypothetical example, a useful check is deliberately simple: does M3 use the same group as M6 when the line claims to show development? Does the original denominator survive inactivity? Does B's unobserved M6 remain missing in the table, chart and export?
Anthropic's engineering guidance distinguishes an agent's account of success from the actual resulting state. For an analytical workflow, I apply that principle to the delivered calculation: inspect the membership and output, rather than accept the agent's sentence that the cohort was fixed. Anthropic: Demystifying evals for AI agents
Three questions before acting on the chart
- What changed between these points: customer behaviour, population, observation age or the metric itself?
- Are we looking at monthly or cumulative revenue, and are we dividing by the original group or a newly filtered subset?
- Can the system show cohort membership, maturity and missing-value handling—and pass a check designed to expose a wrong comparison?
A polished chart is an invitation to ask a better question. Before explaining a trend, I want to know which customers it follows and exactly what each point counts.